Creating an IoT Dashboard with Node-RED on Raspberry Pi
The Internet of Things (IoT) has revolutionized how we interact with technology, providing new ways to monitor and control devices remotely. One of the most popular tools for creating IoT solutions is Node-RED, a flow-based development tool for visual programming. When combined with a Raspberry Pi, you can create powerful IoT dashboards to monitor and control your devices. In this tutorial, we’ll guide you through setting up an IoT dashboard with Node-RED on a Raspberry Pi.
Prerequisites
Before we begin, ensure you have the following:
- A Raspberry Pi with Raspbian OS installed
- ESP32 or NodeMCU device to act as a sensor node
- BMP280 Temperature Sensor ( you can use any sensor to monitor. e.g., temperature sensor, humidity sensor)
- Wi-Fi connection
- Basic understanding of Node-RED

Step 1: Install Node-RED on Raspberry Pi
First, ensure your Raspberry Pi is up to date with node-red.
If you have no experience of using node-red on RPi, I recommend you to read my previous article on "IoT with Node-RED on a RPi"  to have a better understanding before go through the following steps.

[Read Article on "IoT with Node-RED on a RPi"](computer/Introduction-to-Node-Red-on-Raspberry-Pi/){: .btn .btn--success}
Let’s start this tutorial by starting the Node-red on your Raspberry Pi. Open a terminal in Raspberry Pi user interface or access your RPi remotely using SSH and run following command to start Node-Red:
Start Node-RED on RPi:
node-red-start
You can now access Node-RED User interface by navigating to http://
Step 2: Creating the Flow
Let’s create two simple flows to display sensor data on the dashboard. In this example We’ll use a BMP280 temperature,pressure sensor as an example. You can use any sensor simillar to this one. We are going to create two flows to read and visualize temperature readings and pressure readings separately.
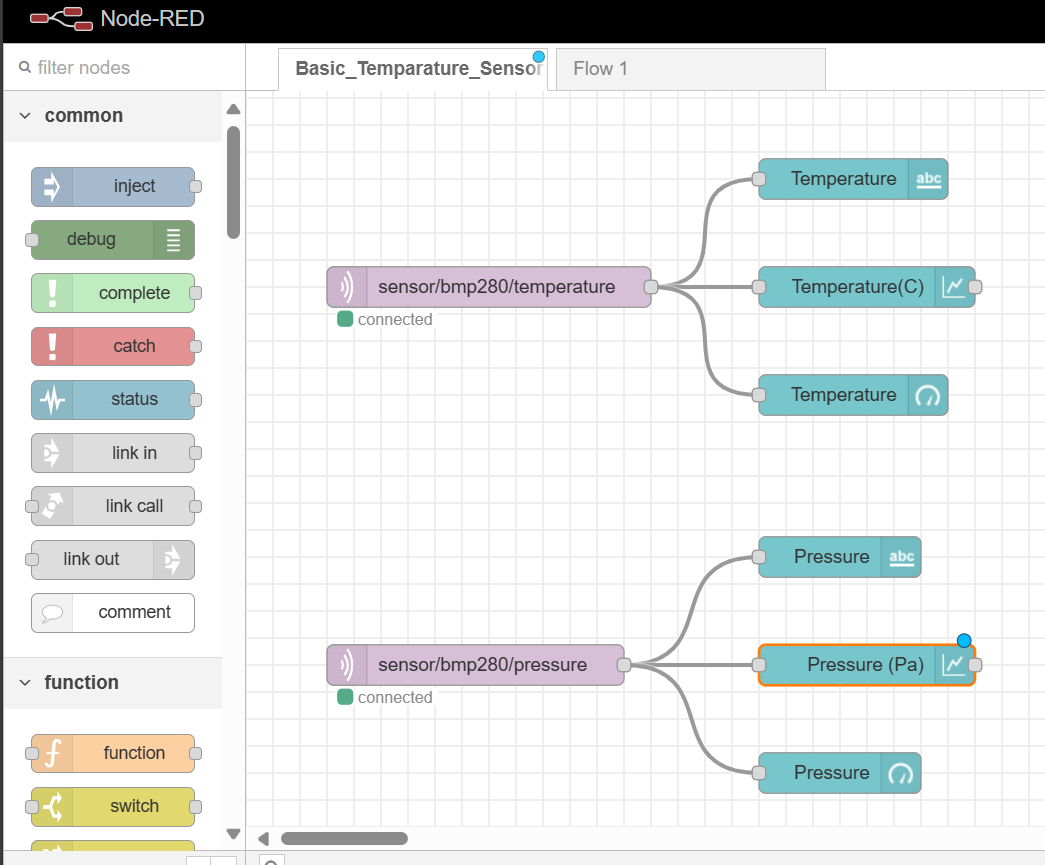
- Temperature monitor flow
First of all, you need to select and place a mqtt node from the left side nodes list panel. Double click on the node and it will open up a configuration window as follows.
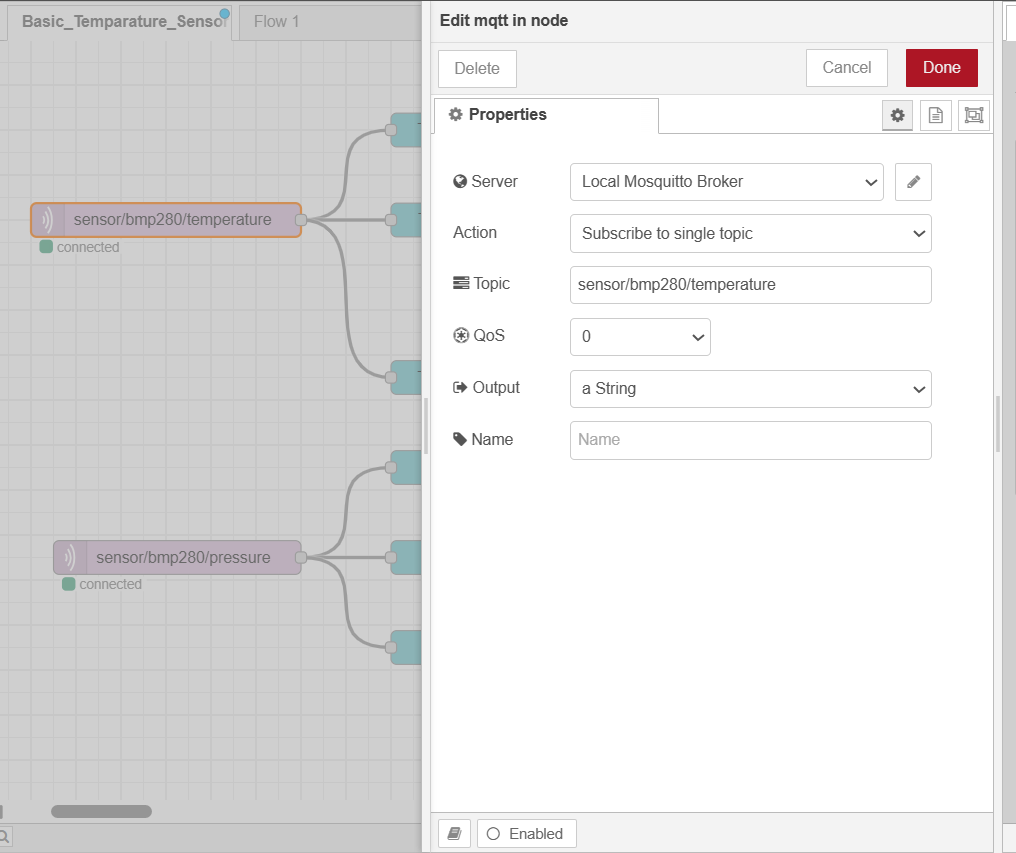
There you can configure the “topic” as “sensor/bpm280/temperature”. We use this topic to publish sensor data from the ESP32 sensor node and the same tpoic is used in here to subscribe and read the temperature data.
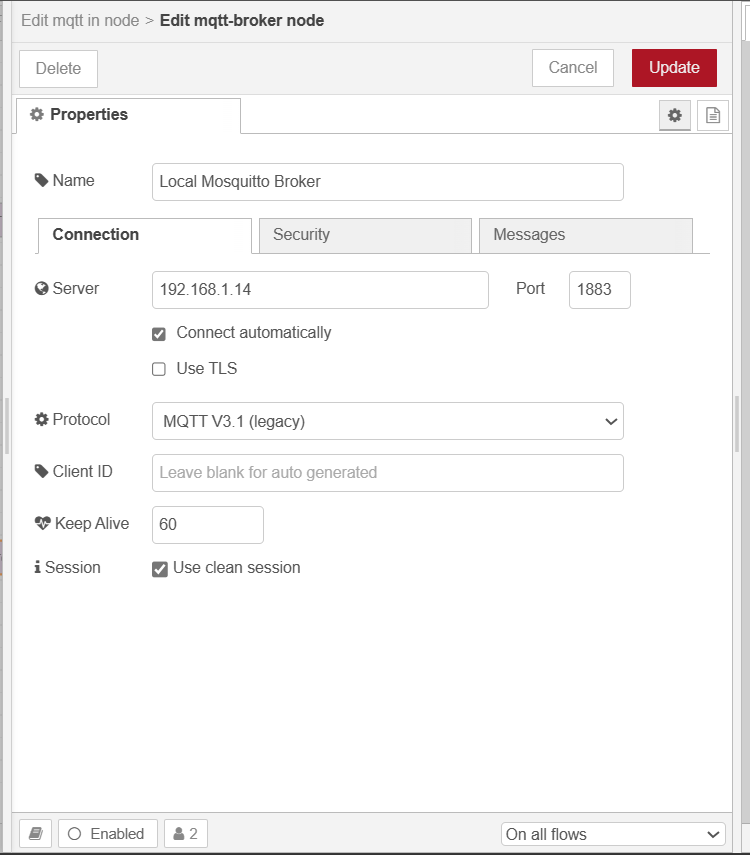
Next you need to add an MQTT broker from the same configuration window. Click on the eidt butto and it will open up a new configuration window to a new MQTT broker as follows.
- Add an Inject Node:
- This node will simulate sensor data.
- Drag an “Inject” node from the palette to the flow editor.
- Double-click the node to configure it.
- Set the payload type to “Number” and specify a value (e.g., 25).
- Add a Function Node: This node will process the sensor data.
- Drag a “Function” node to the flow editor.
- Connect the output of the “Inject” node to the input of the “Function” node.
- Double-click the “Function” node and enter the following code:
Copy code
msg.payload = {
    temperature: msg.payload
};
return msg;
- Add a Dashboard Node: This node will display the data on the dashboard.
- Drag a “Gauge” node from the “dashboard” section to the flow editor.
- Connect the output of the “Function” node to the input of the “Gauge” node.
- Double-click the “Gauge” node to configure it.
- Set the Group to “Add new ui_group” and name it (e.g., “Home”).
- Set the Label to “Temperature” and the value format to .
- Deploy the Flow: Click the “Deploy” button in the top right corner to deploy your flow.
Step 3: Setting Up the Nodes
Node-RED includes a dashboard module that allows you to create a web-based user interface. To install the dashboard nodes, run the following command in the Node-RED interface:
1. Click on the menu (three horizontal lines) in the top right corner.
2. Select "Manage palette".
3. Go to the "Install" tab.
4. Search for node-red-dashboard.
5. Click the install button.
Step 4: Accessing the Dashboard
After deploying the flow, you can access your dashboard by navigating to http://
Step 5: Adding More Widgets
You can add more widgets to your dashboard to display different types of data or control devices. For example, you can add charts, buttons, and text fields to create a comprehensive IoT dashboard.
- Charts: Use the “Chart” node to visualize data over time.
- Buttons: Use the “Button” node to control devices (e.g., turn on/off a light).
- Text Fields: Use the “Text input” node to input data.
Conclusion
Creating an IoT dashboard with Node-RED on a Raspberry Pi is a powerful way to monitor and control your IoT devices. With Node-RED’s intuitive visual interface, you can quickly build and customize your dashboard to suit your needs. Whether you’re a hobbyist or a professional, Node-RED provides the tools you need to create sophisticated IoT applications.
Happy hacking!
If you found this tutorial helpful, feel free to share it with others. For more guides and tutorials on IoT and Node-RED, stay tuned to our blog!
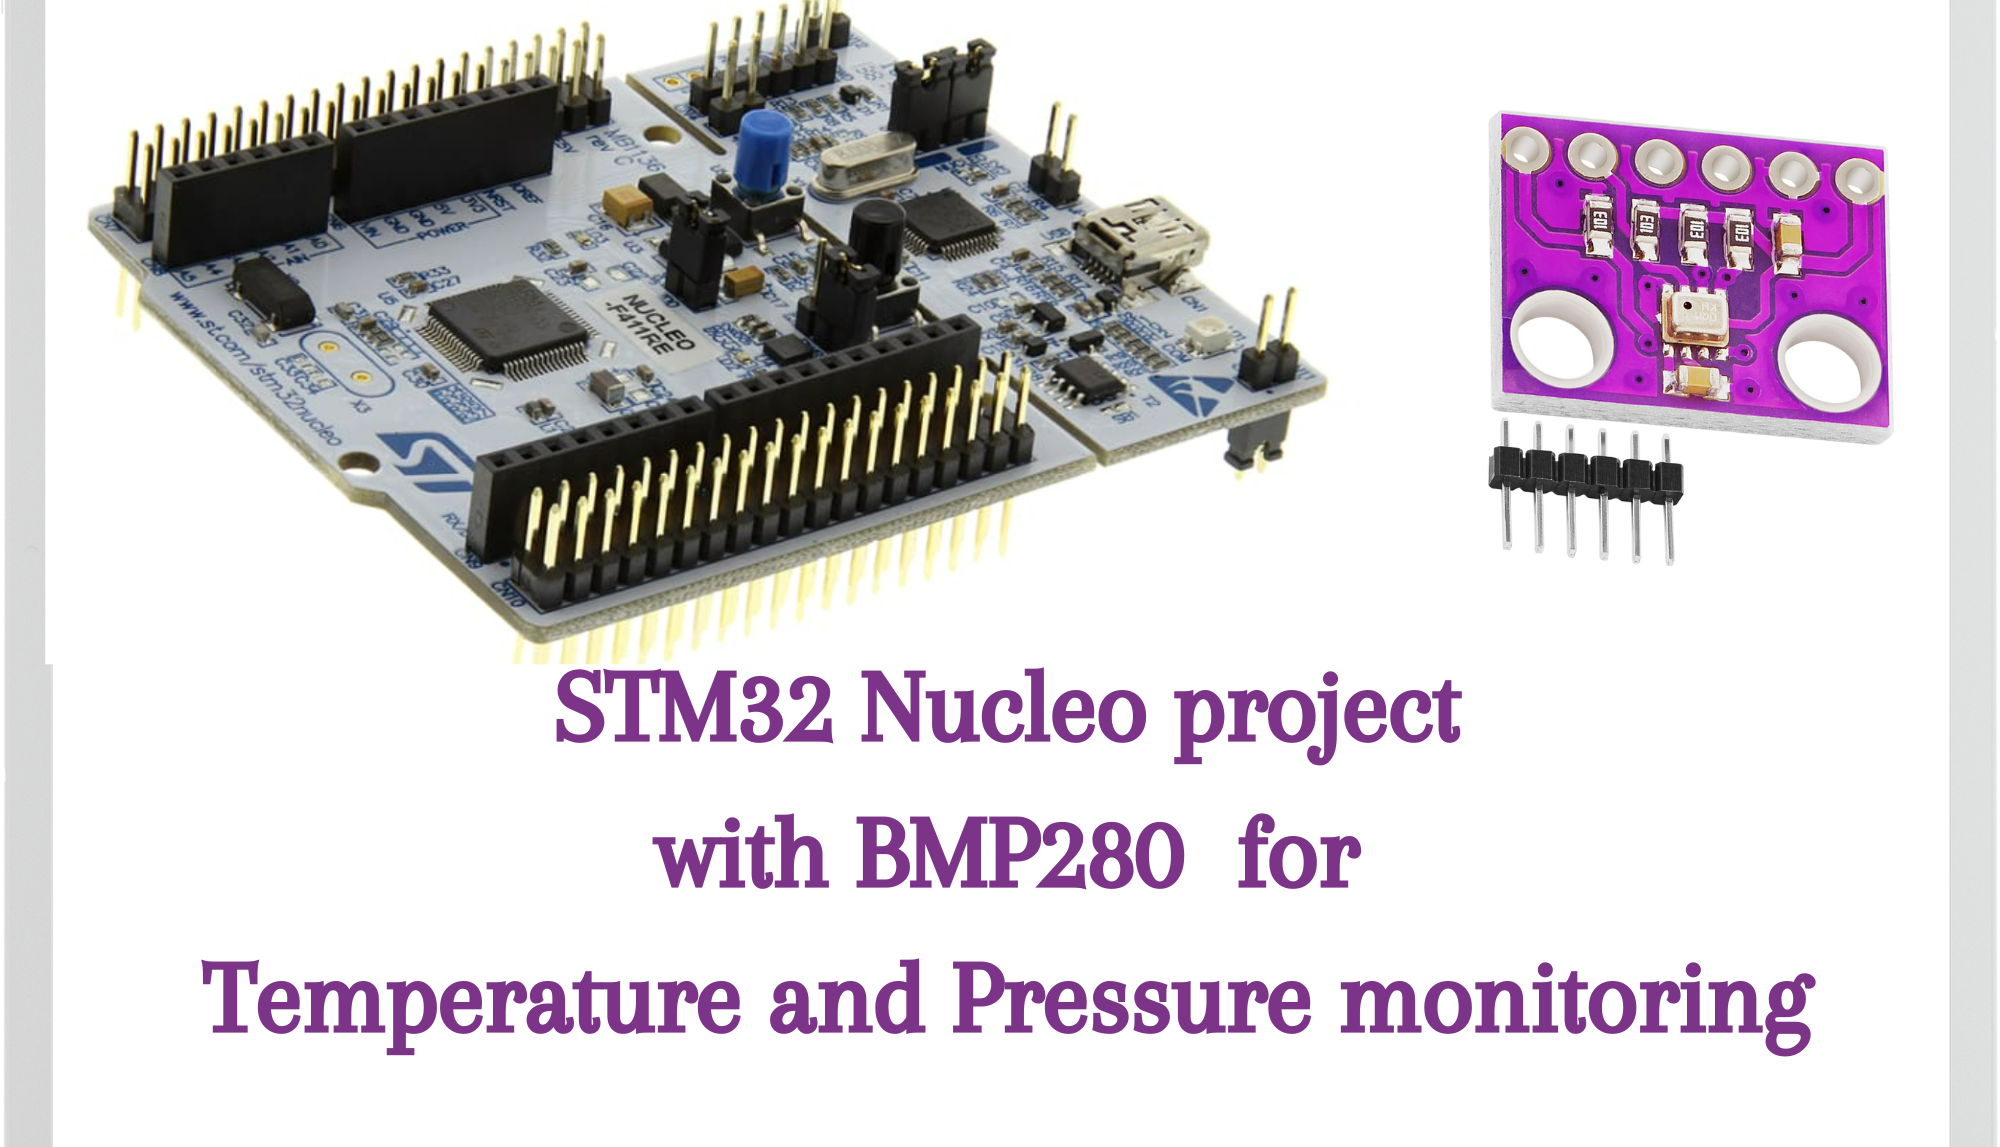
By the end of this blog post, readers should have a comprehensive understanding of how to integrate the BME280 temperature sensor with the STM32 Nucleo development board, along with insights into its potential applications in environmental sensing projects.



Leave a comment